
If you're running a growing business, tracking each stage of the funnel is non-negotiable. Here’s how I break it down to keep everything in check.
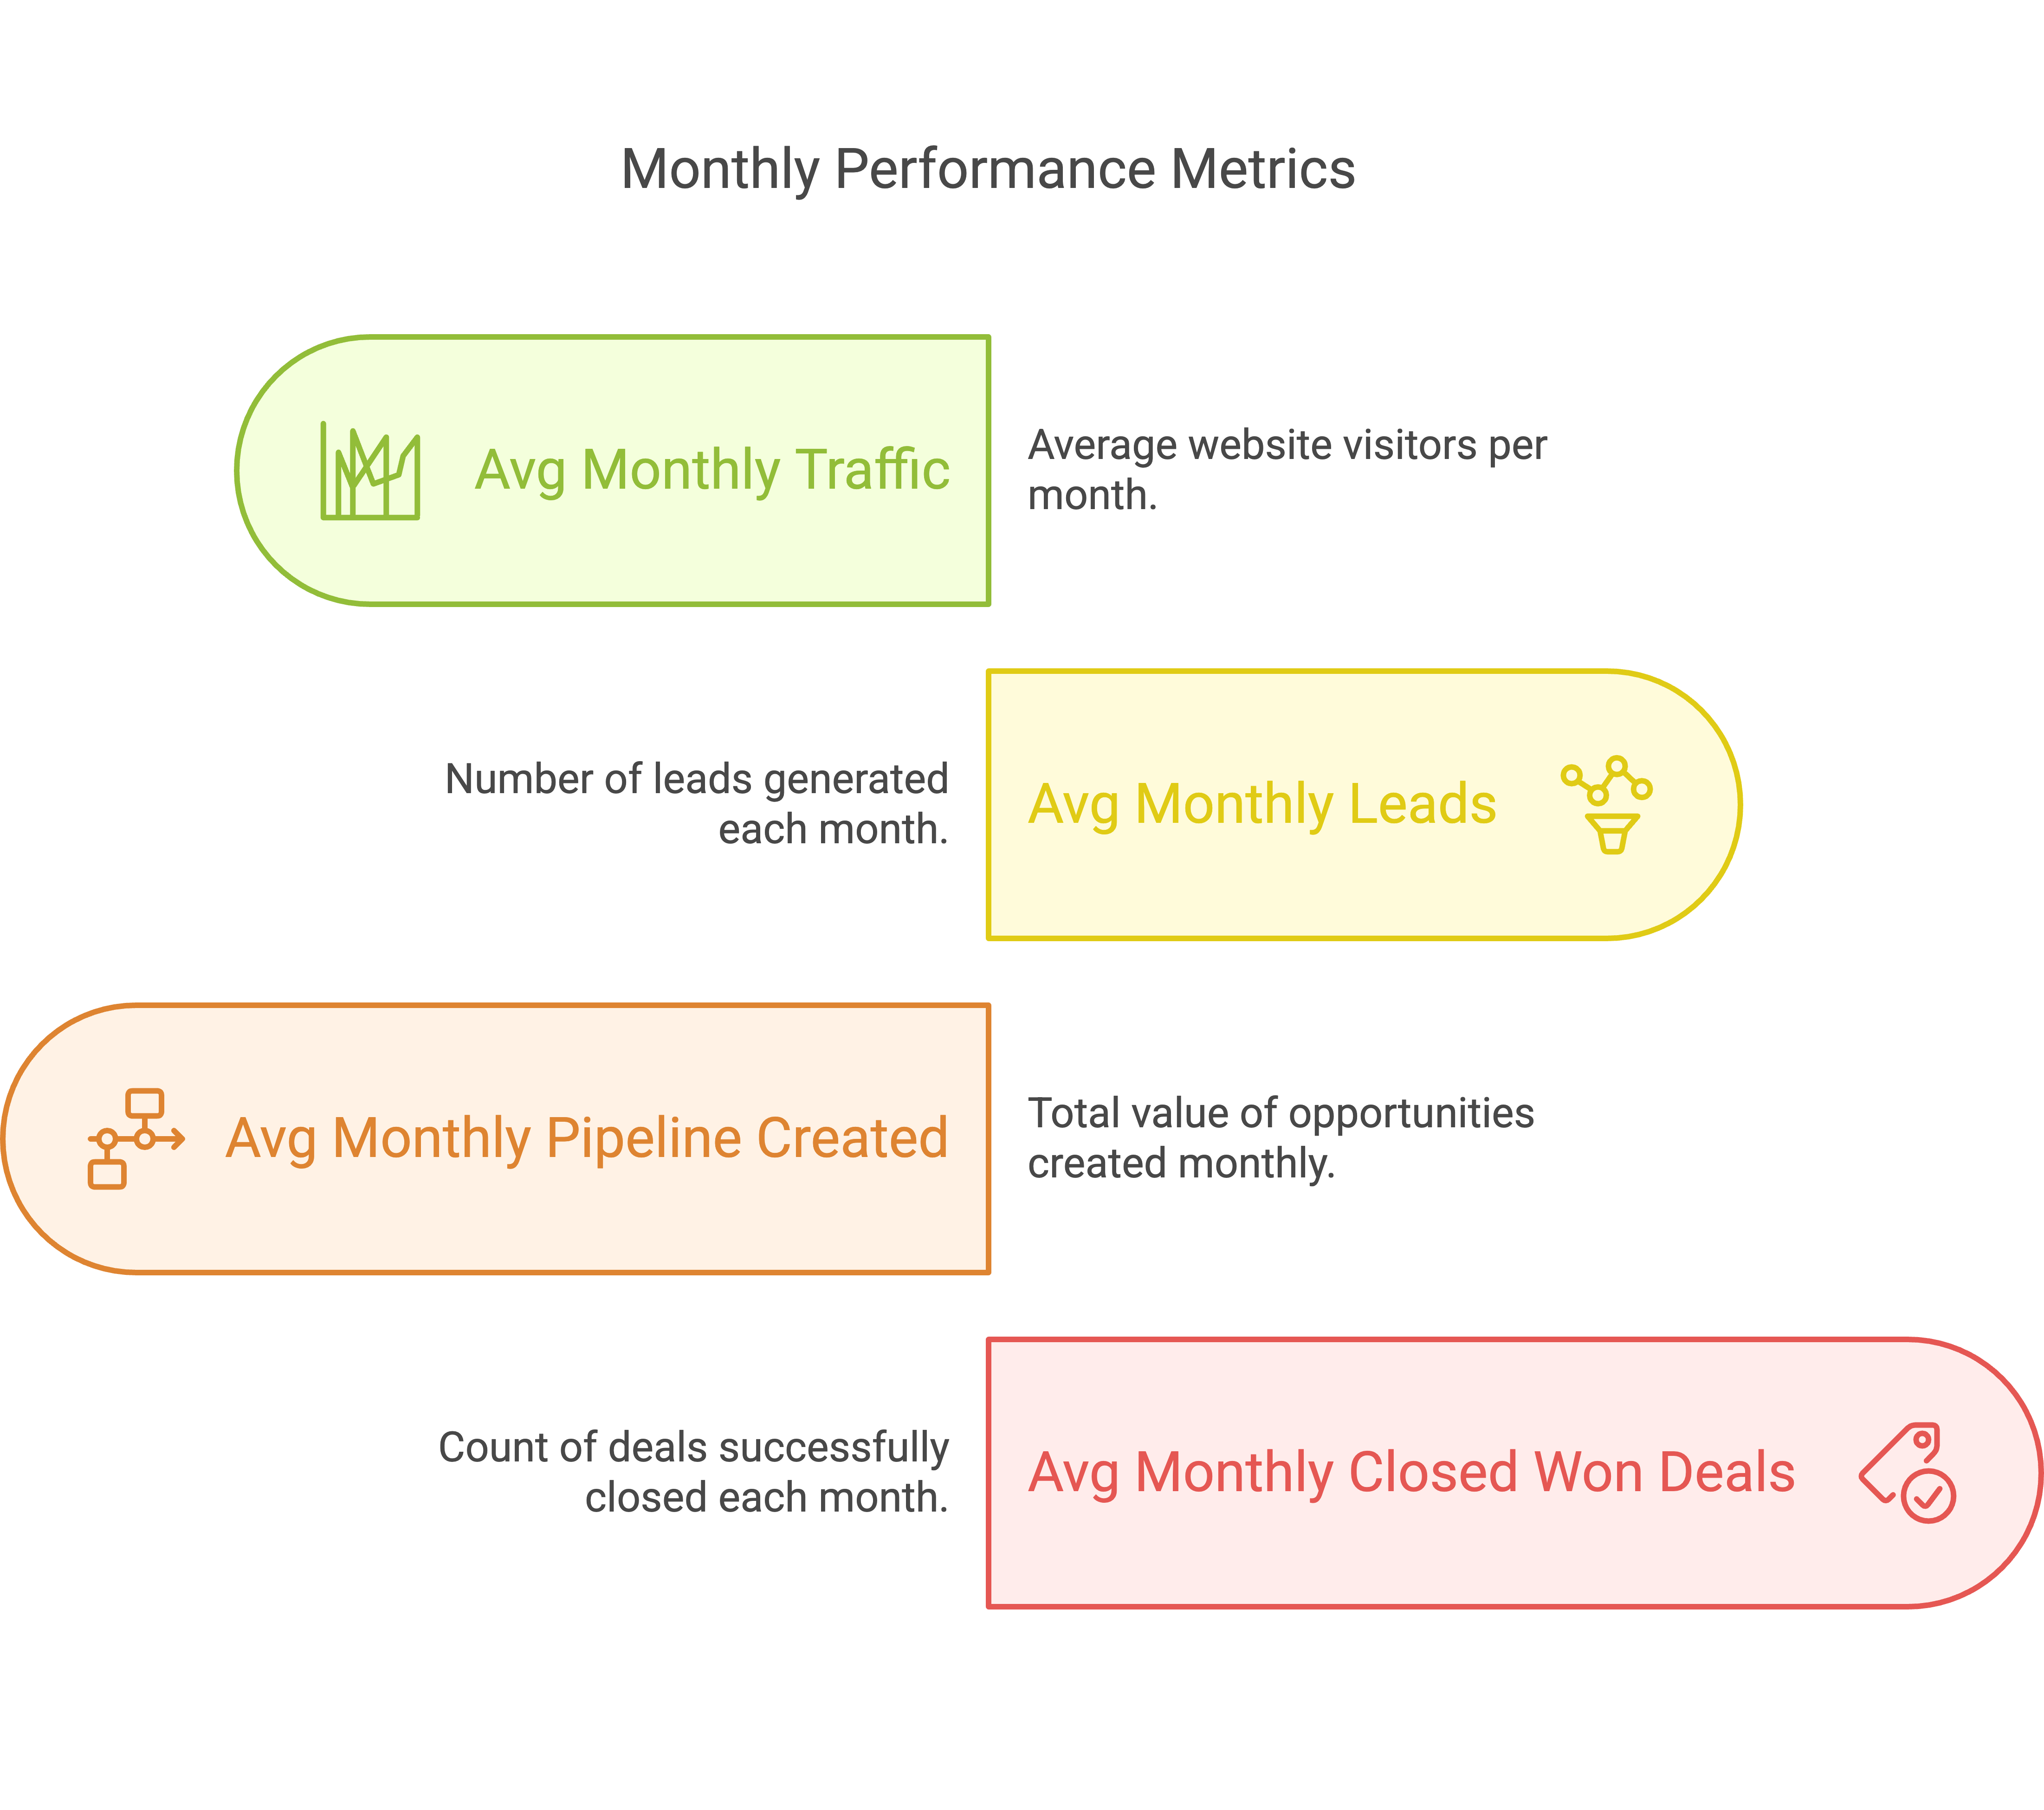
At a high level, I’m tracking:
Avg Monthly Traffic (Google Analytics)
Avg Monthly Leads (HubSpot)
Avg Monthly Pipeline Created (Salesforce)
Avg Monthly Closed Won Deals (Salesforce)
At this point, you already have an idea of what you’d want to look into deeper. However, while doing a full-funnel overview, everything from top to bottom is almost always connected. We need to now go one level deeper at each stage of the funnel to spot trends and bottlenecks.
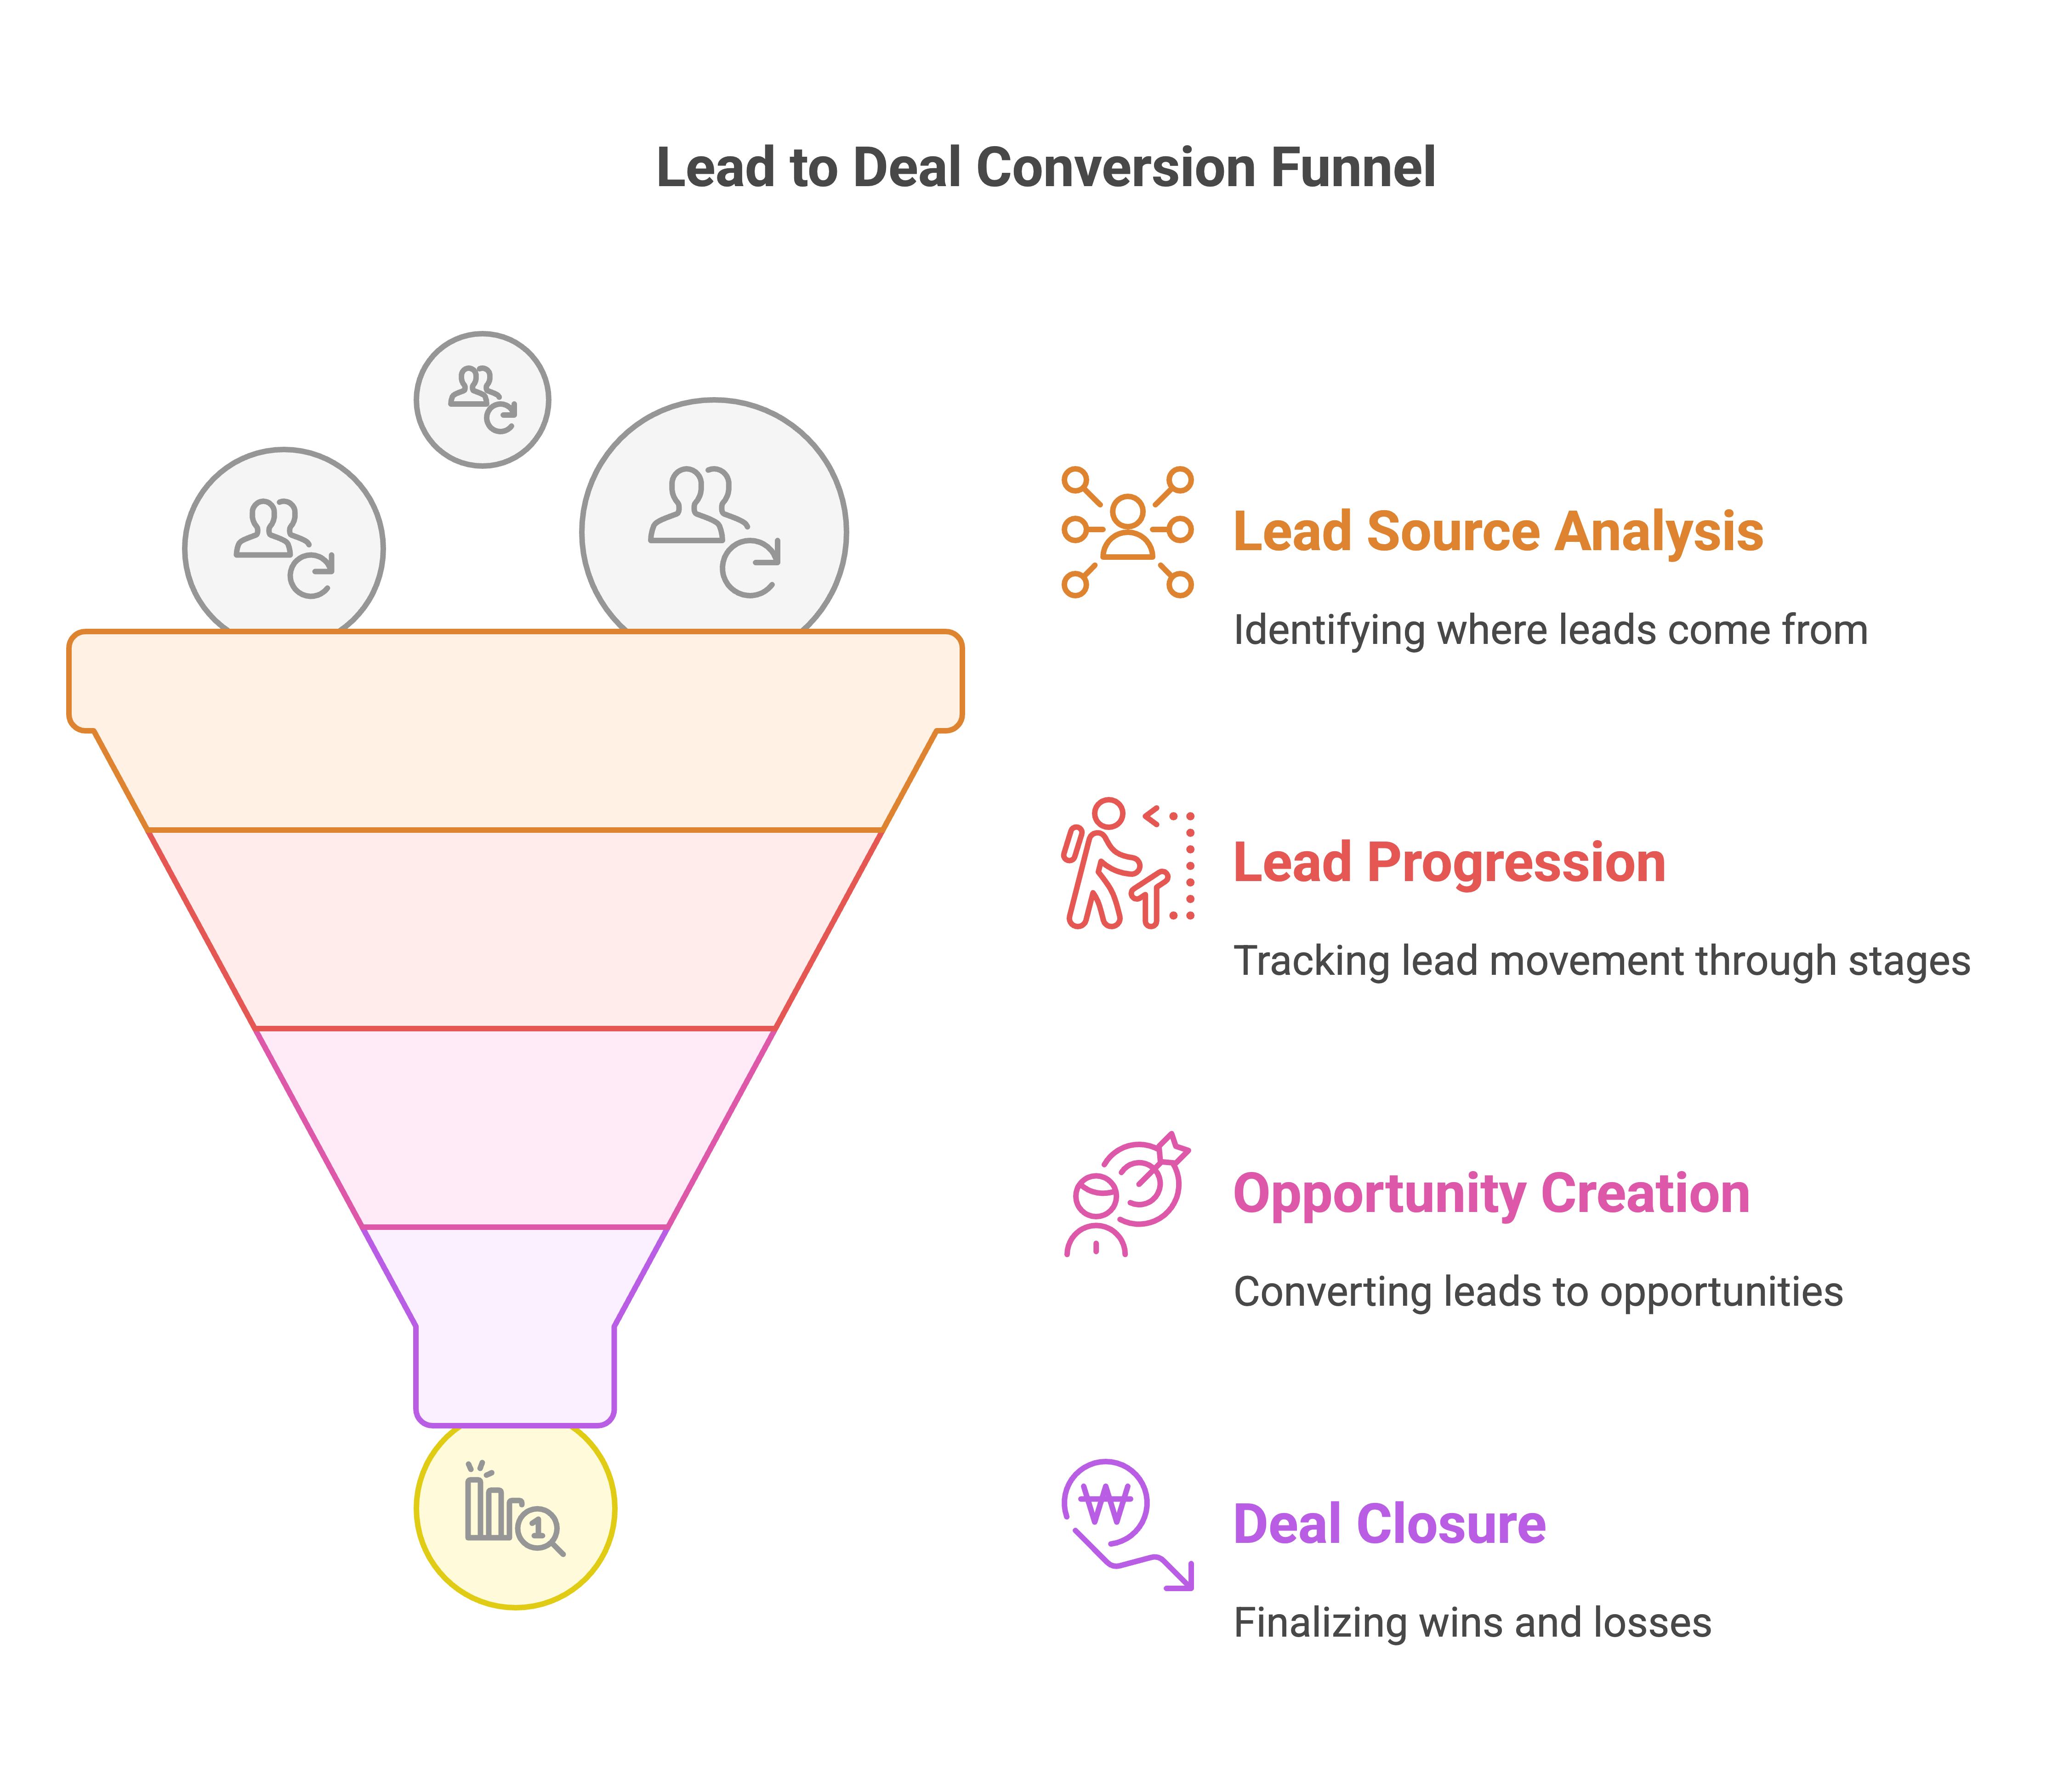
This is where it all starts.
We’re not just interested in how many people land on the site—we care about where they come from, what they do, and if they convert not only to leads but qualified leads that turn into opportunities and deals.
Monthly Trend of Leads by Source
Monthly Trend of Leads by Stage
Leads are great, but until they turn into deals in the pipeline, they’re just names in your CRM.
Monthly Pipeline Created
Monthly Pipeline Closed Won
Monthly Closed Lost
Revenue Lost by Reason
Finally, we need to keep an eye on how the sales team is performing. After all, they're the ones converting pipeline into dollars.
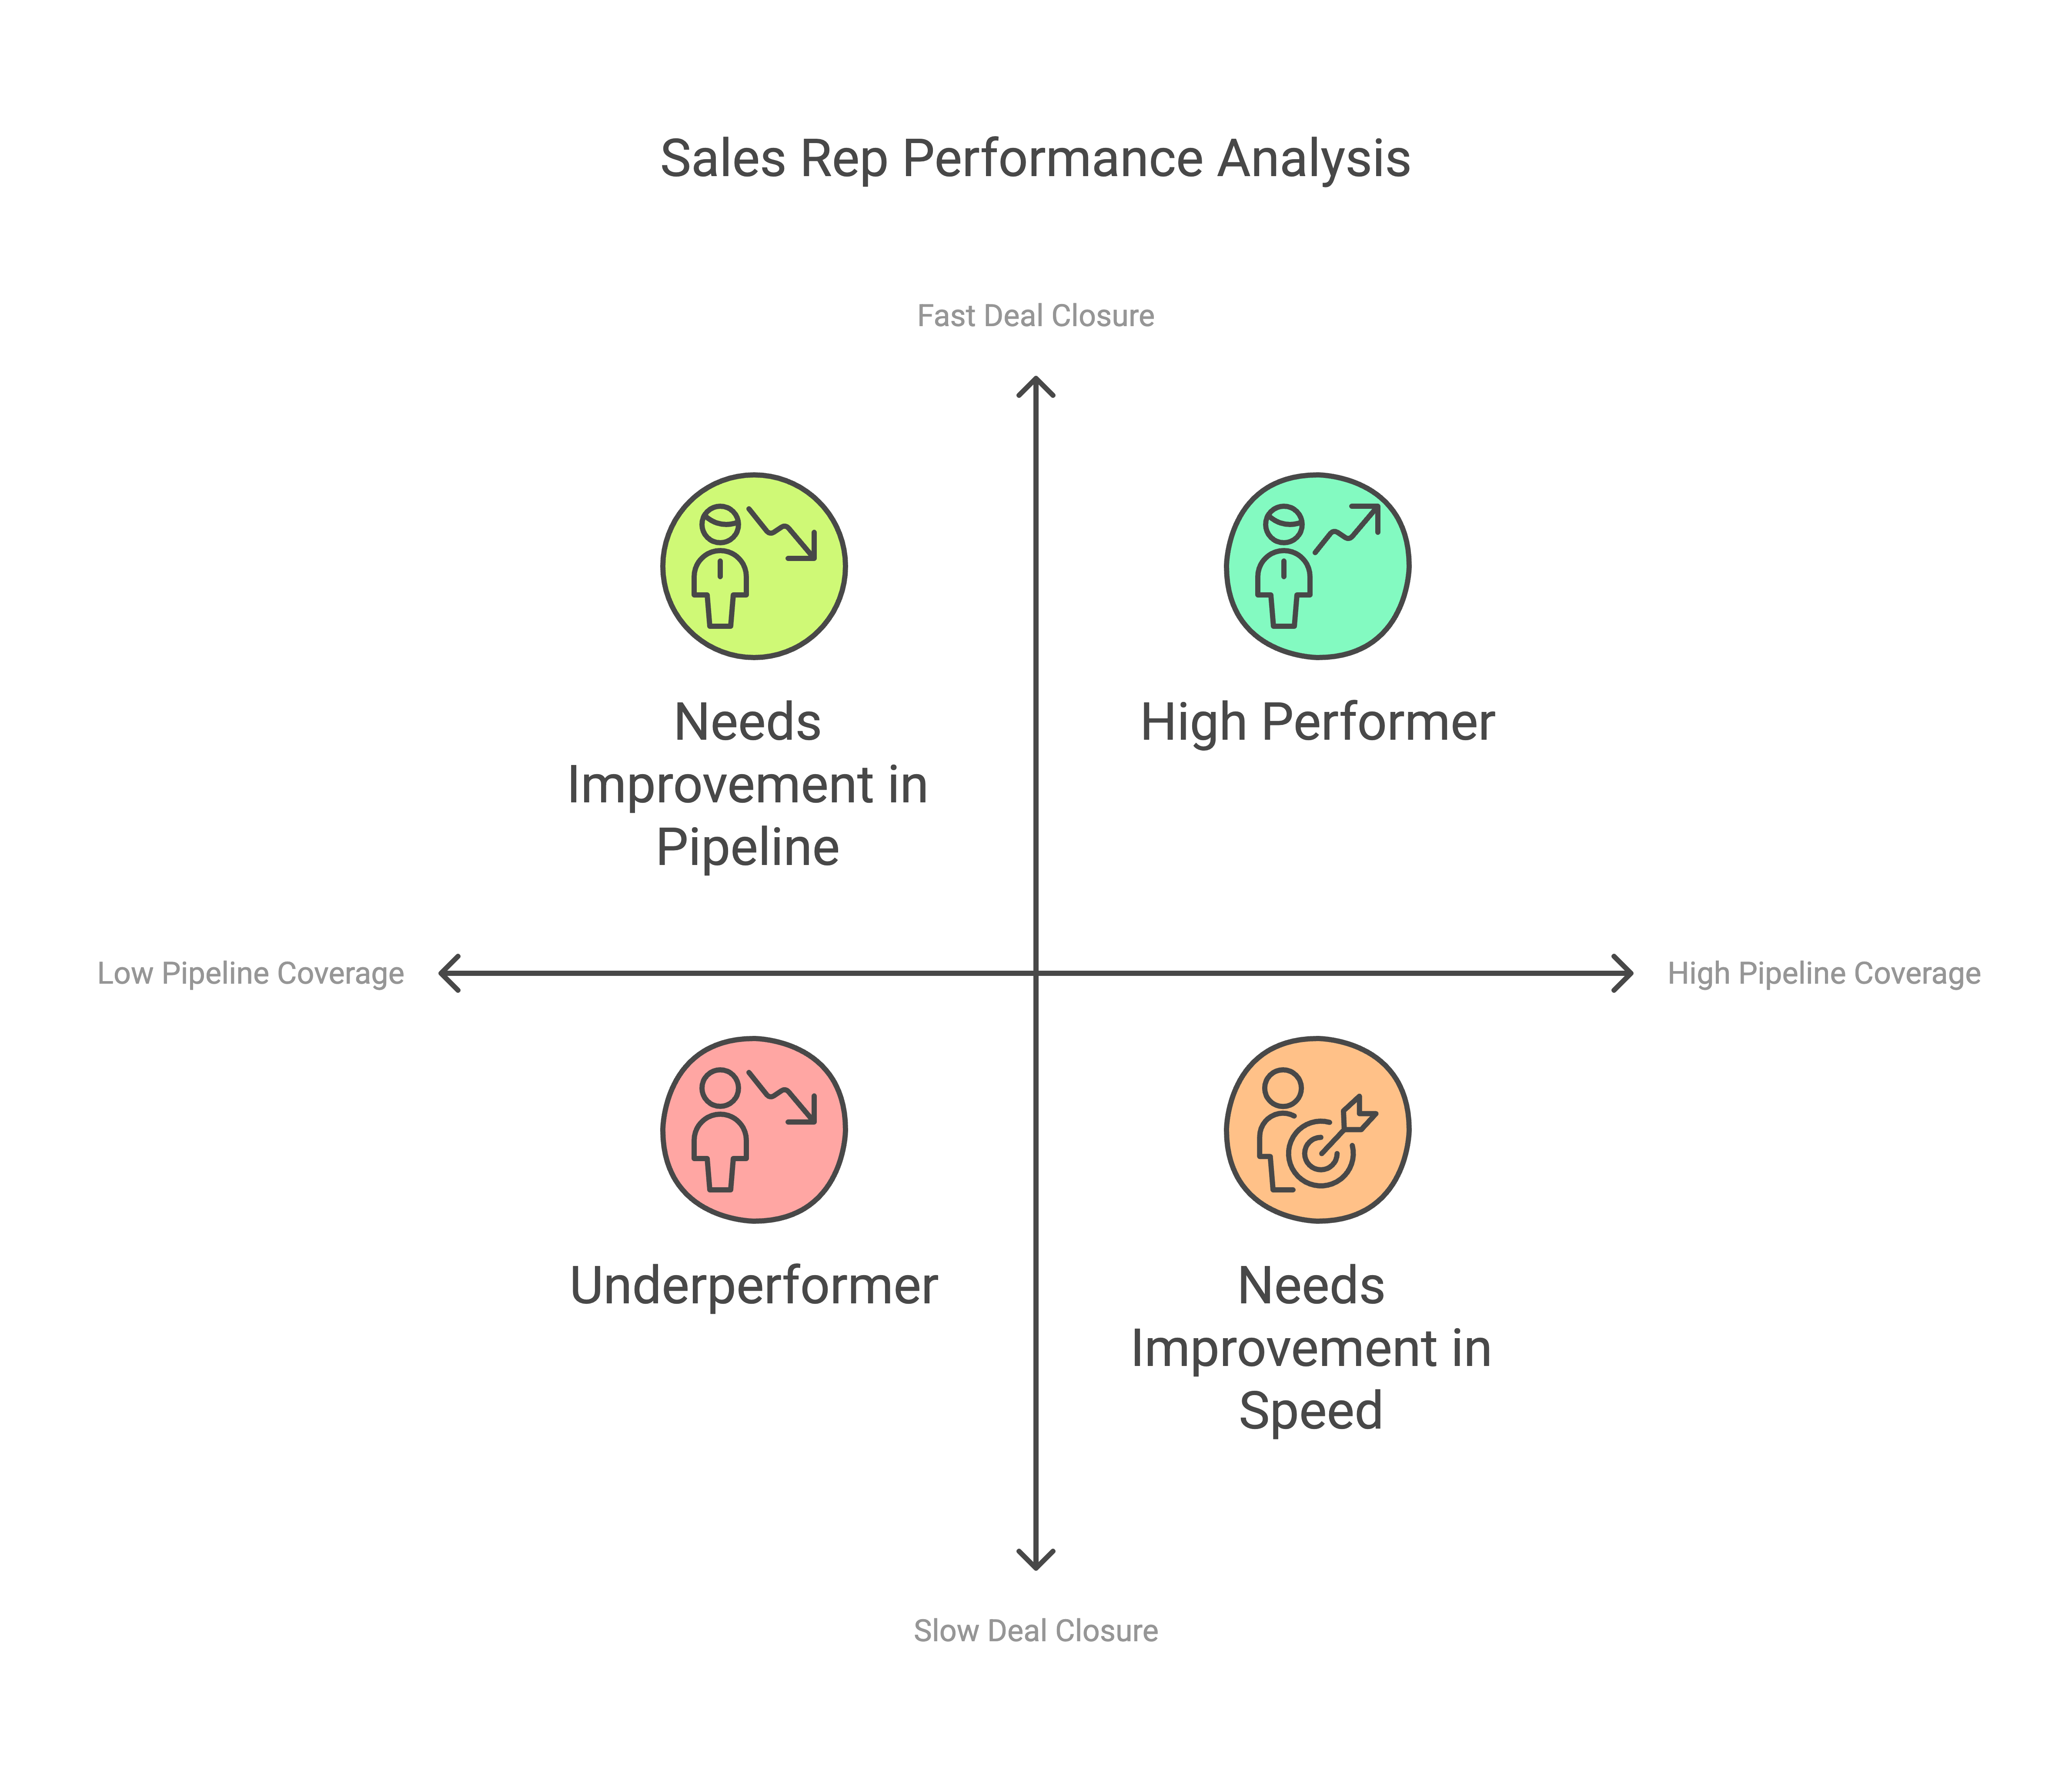
Pipeline Coverage Ratios by Reps
Avg Days to Close by Reps
Days to Move Between Stages by Reps
Win/Loss Ratios by Reps
To be honest, the funnel isn’t a linear, one-size-fits-all process.
There are nuances at every stage, and you won’t always get it right the first time. But the beauty of this kind of analysis is that it gives you clarity.
Ultimately, this is about constant iteration. You’re not just tracking numbers for the sake of it. You’re looking for patterns—where are you gaining momentum, and where are you bleeding potential revenue?
If you’re willing to face the data head-on, you’ll find opportunities to grow faster, smarter, and more sustainably.