

What is collaborative analytics?
Learn about collaborative analytics to understand the challenges and strategies for effective data teamwork. Learn how Airbook enhances data analysis and decision-making in modern teams.

We’ve all been there before, staring blankly at a pretty looking bar chart being presented in a meeting room- to show how our sales have been trending this quarter.
Everyone is happy seeing a trend going up but then..someone points out-
“Hey, my dashboard says something different- Are you sure the numbers are accurate?”
After an awkward silence of 2 minutes, the person who is presenting adds-
“Let’s take this offline, I’ll just check with our analyst and get back to you”
Something feels off.
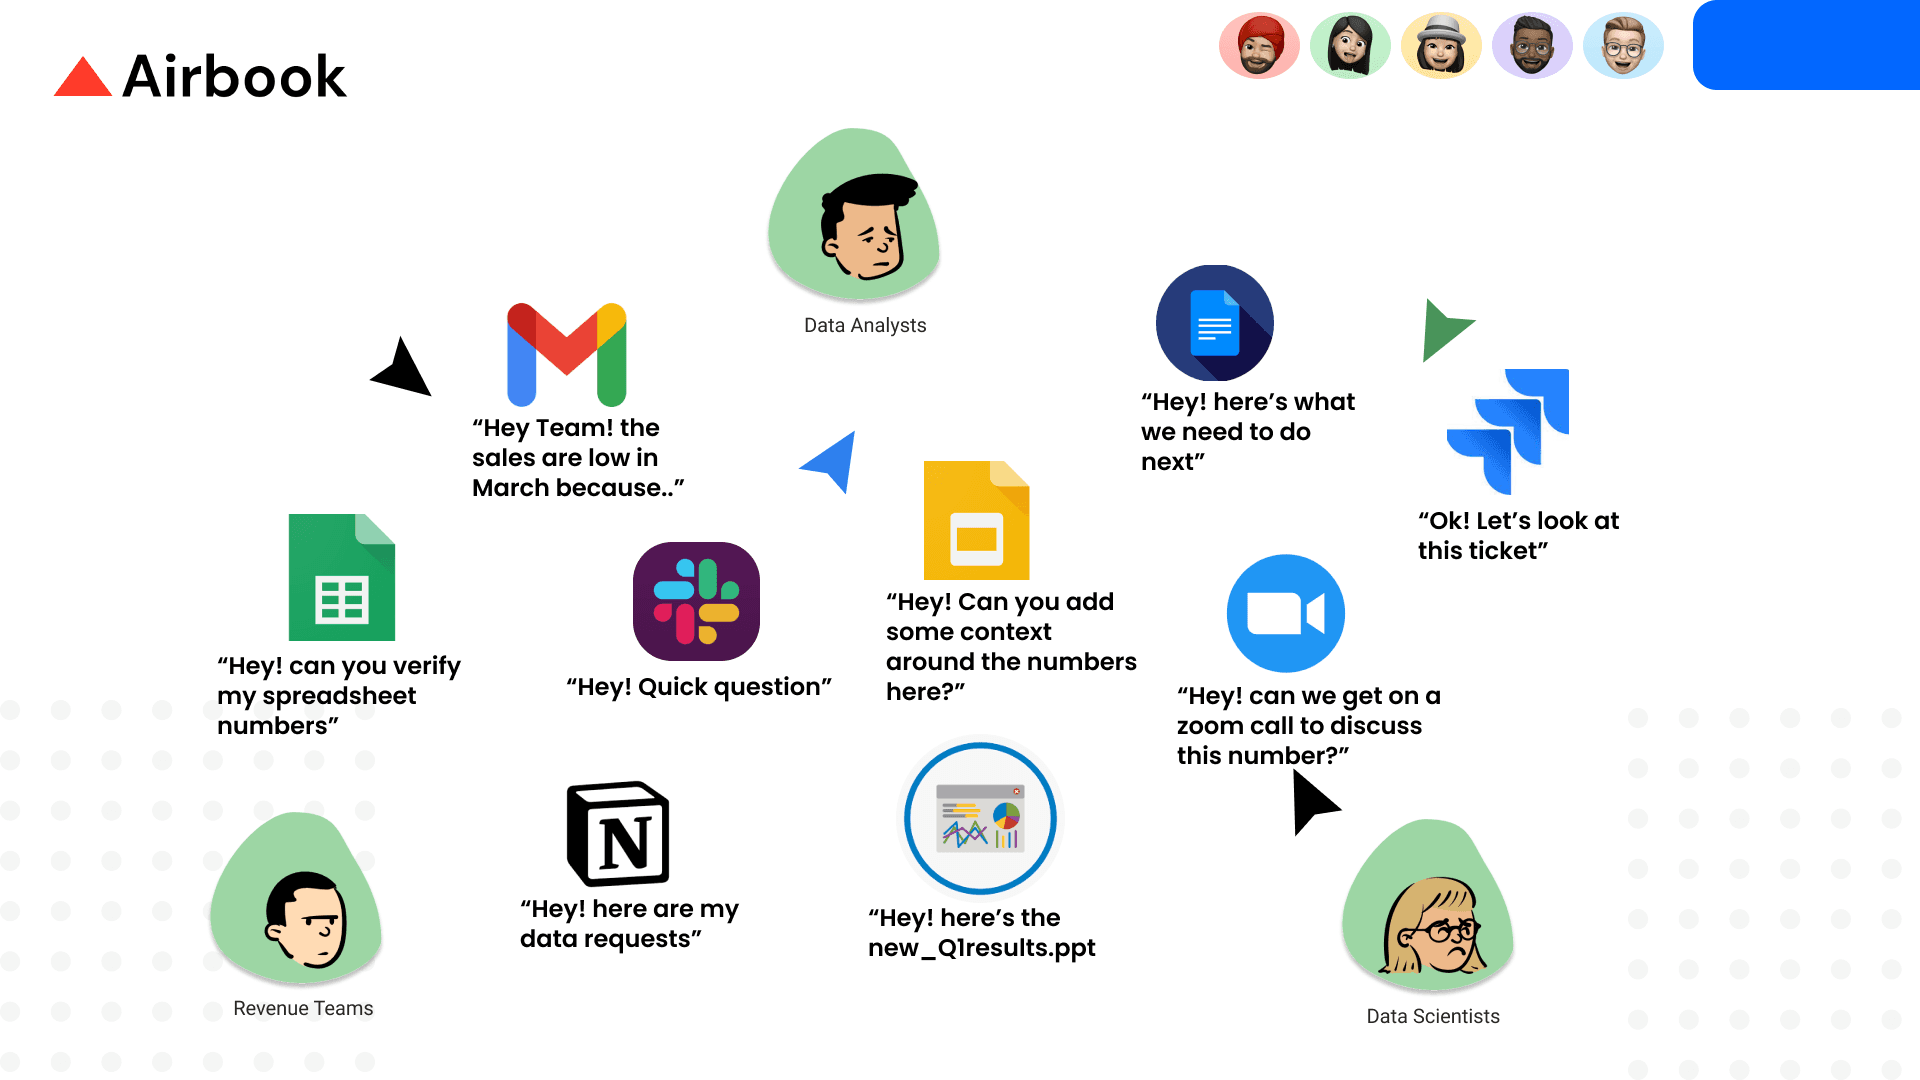
There is silence and everyone eventually leaves the meeting and dives back into their digital “collaboration” tools, running through their data enquiries - relaying a series of adhoc data requests over slack, exporting reports over to multiple google sheets, setting-up internal zoom calls, replying back on the email chain with updates and the list goes on.
Emails, slack messages, zoom invites, google docs and more emails.. this is how we collaborate over data.
Why is it so hard to work together when it comes to data?
So we did some research and found that data projects are collaborative, but today’s data tools are not!
It all starts with an enquiry
The analytical workflow for data exploration starts with a question or an enquiry that usually takes the form of-
A quick ad-hoc message on slack or
A bulleted list of data requirements often sent through Google Docs/Notion or Email
The process to form the data question in the best way possible may itself require collaboration between multiple roles in the team. This also has it’s own internal feedback loop between non-data teams and data teams to refine what we really want to answer with data or to validate the numbers they see on their dashboards.
Data is not always black or white
Next, we need context around those numbers.
Here’s where both- non-data and data teams add some ‘color’ to the analysis (not on charts)
Together, both teams rely heavily on data from different sources to make decisions, but often lack the necessary context and understanding to make the best decisions. To ensure teams are making the best decisions possible, they must adopt a process-oriented approach that allows them to create a feedback loop and continuously refine their decision-making process.
Teams involved in the analytical process tend to first to self-organize information and collaboratively give insights behind the ‘why’ and ‘how’ of the numbers they see- applying logical questions to create a framework to make sense of the information. This framework includes key decision points, data needed to make those decisions, and criteria for analyzing the data.
A ‘quick data request’ like
“Hey Hosh, give me a report to show why sales are low in March”
is not helpful. I used to get slightly frustrated.
Further context from non-data or GTM teams helps an analyst understand what we’re are really going after and that’s important.
Today, contextual analysis is done over multiple email chains, slack messages or at worst 5 more meetings- this back and forth is a major energy drainer and all the knowledge is often lost in transit.
We’ve found that a data practitioner feels the need to collaborate with at-least 2 other data practitioners and/or at-least 5 other members from non-data teams for >80% of the data requests that come their way.
The feedback loop
Once the chart/dashboard has been shared, there are trailing conversations that the teams have before they can make a decision. Questions like-
“Hey! Sales are low in January, why do you think so? Did we also receive less demo requests in Jan? Let’s check?”
“Hey the product usage from our free users spiked in March! That’s amazing, maybe the new feature did it or was it something else? Let’s validate?”
The work on analytical feedback is haphazardly recorded among a sea of scratch work in disparate digital ‘rough books’. Conversations around data is where the actual contextual knowledge lies and this knowledge actually accumulates, but is washed away by the Slack/Email firehose.
All the knowledge is lost in transit over multiple channels of communication so the next time they want to look at why did they decided on something, they have to either go through all the emails/slack messages or just repeat the process (well, of creating a new dashboard)!
Analytics is almost like product management- there are releases, feedback sessions and more releases. It’s an iterative process and needs to go through a couple of loops and these loops require rapid prototyping at most times.
Feedback may come from literally anywhere- be it the CEO of the company sending a high priority email or a VP of Sales taking a screenshot from the dashboard and sending it over on a slack channel.
The feedback loop is important when you are exploring or deep-diving into your data in the pursuit of finding that one insight that may help the business make a revenue impacting decision.
We need a place, everyone can call ‘Home’
To ensure our time is spent effectively- What we learn from data, what we say about it together and eventually what we did with the information that was evaluated is essential to be recorded in a single place.
Modern teams ‘self-organize’ first in a way they are best able to consume information and then collaborate within their own circles of trusted humans to validate decisions.
Notion, Google Docs, Slack, Figma are all modern tools that create seamless experiential layers that win because they bring people together.
Empowering everyone to organize information in their own way and collaborate to gain consensus (e.g. polls), enable majority voting (e.g. upvotes), make autocratic decisions and ask for consent (e.g. approval processes) AND being able to act on insights, from one page.
As we’ve been building Airbook we’ve been interviewing a number of organizations to see how a collaborative data workspace would change the way data is used amongst teams. Here’s what we’ve found-
Workspaces in general make information consumable by everyone, in one single place. Thereby, trust issues start to improve since they are viewable (and interpretable) by anyone so no one dismisses the numbers on the basis of not knowing where they came from.
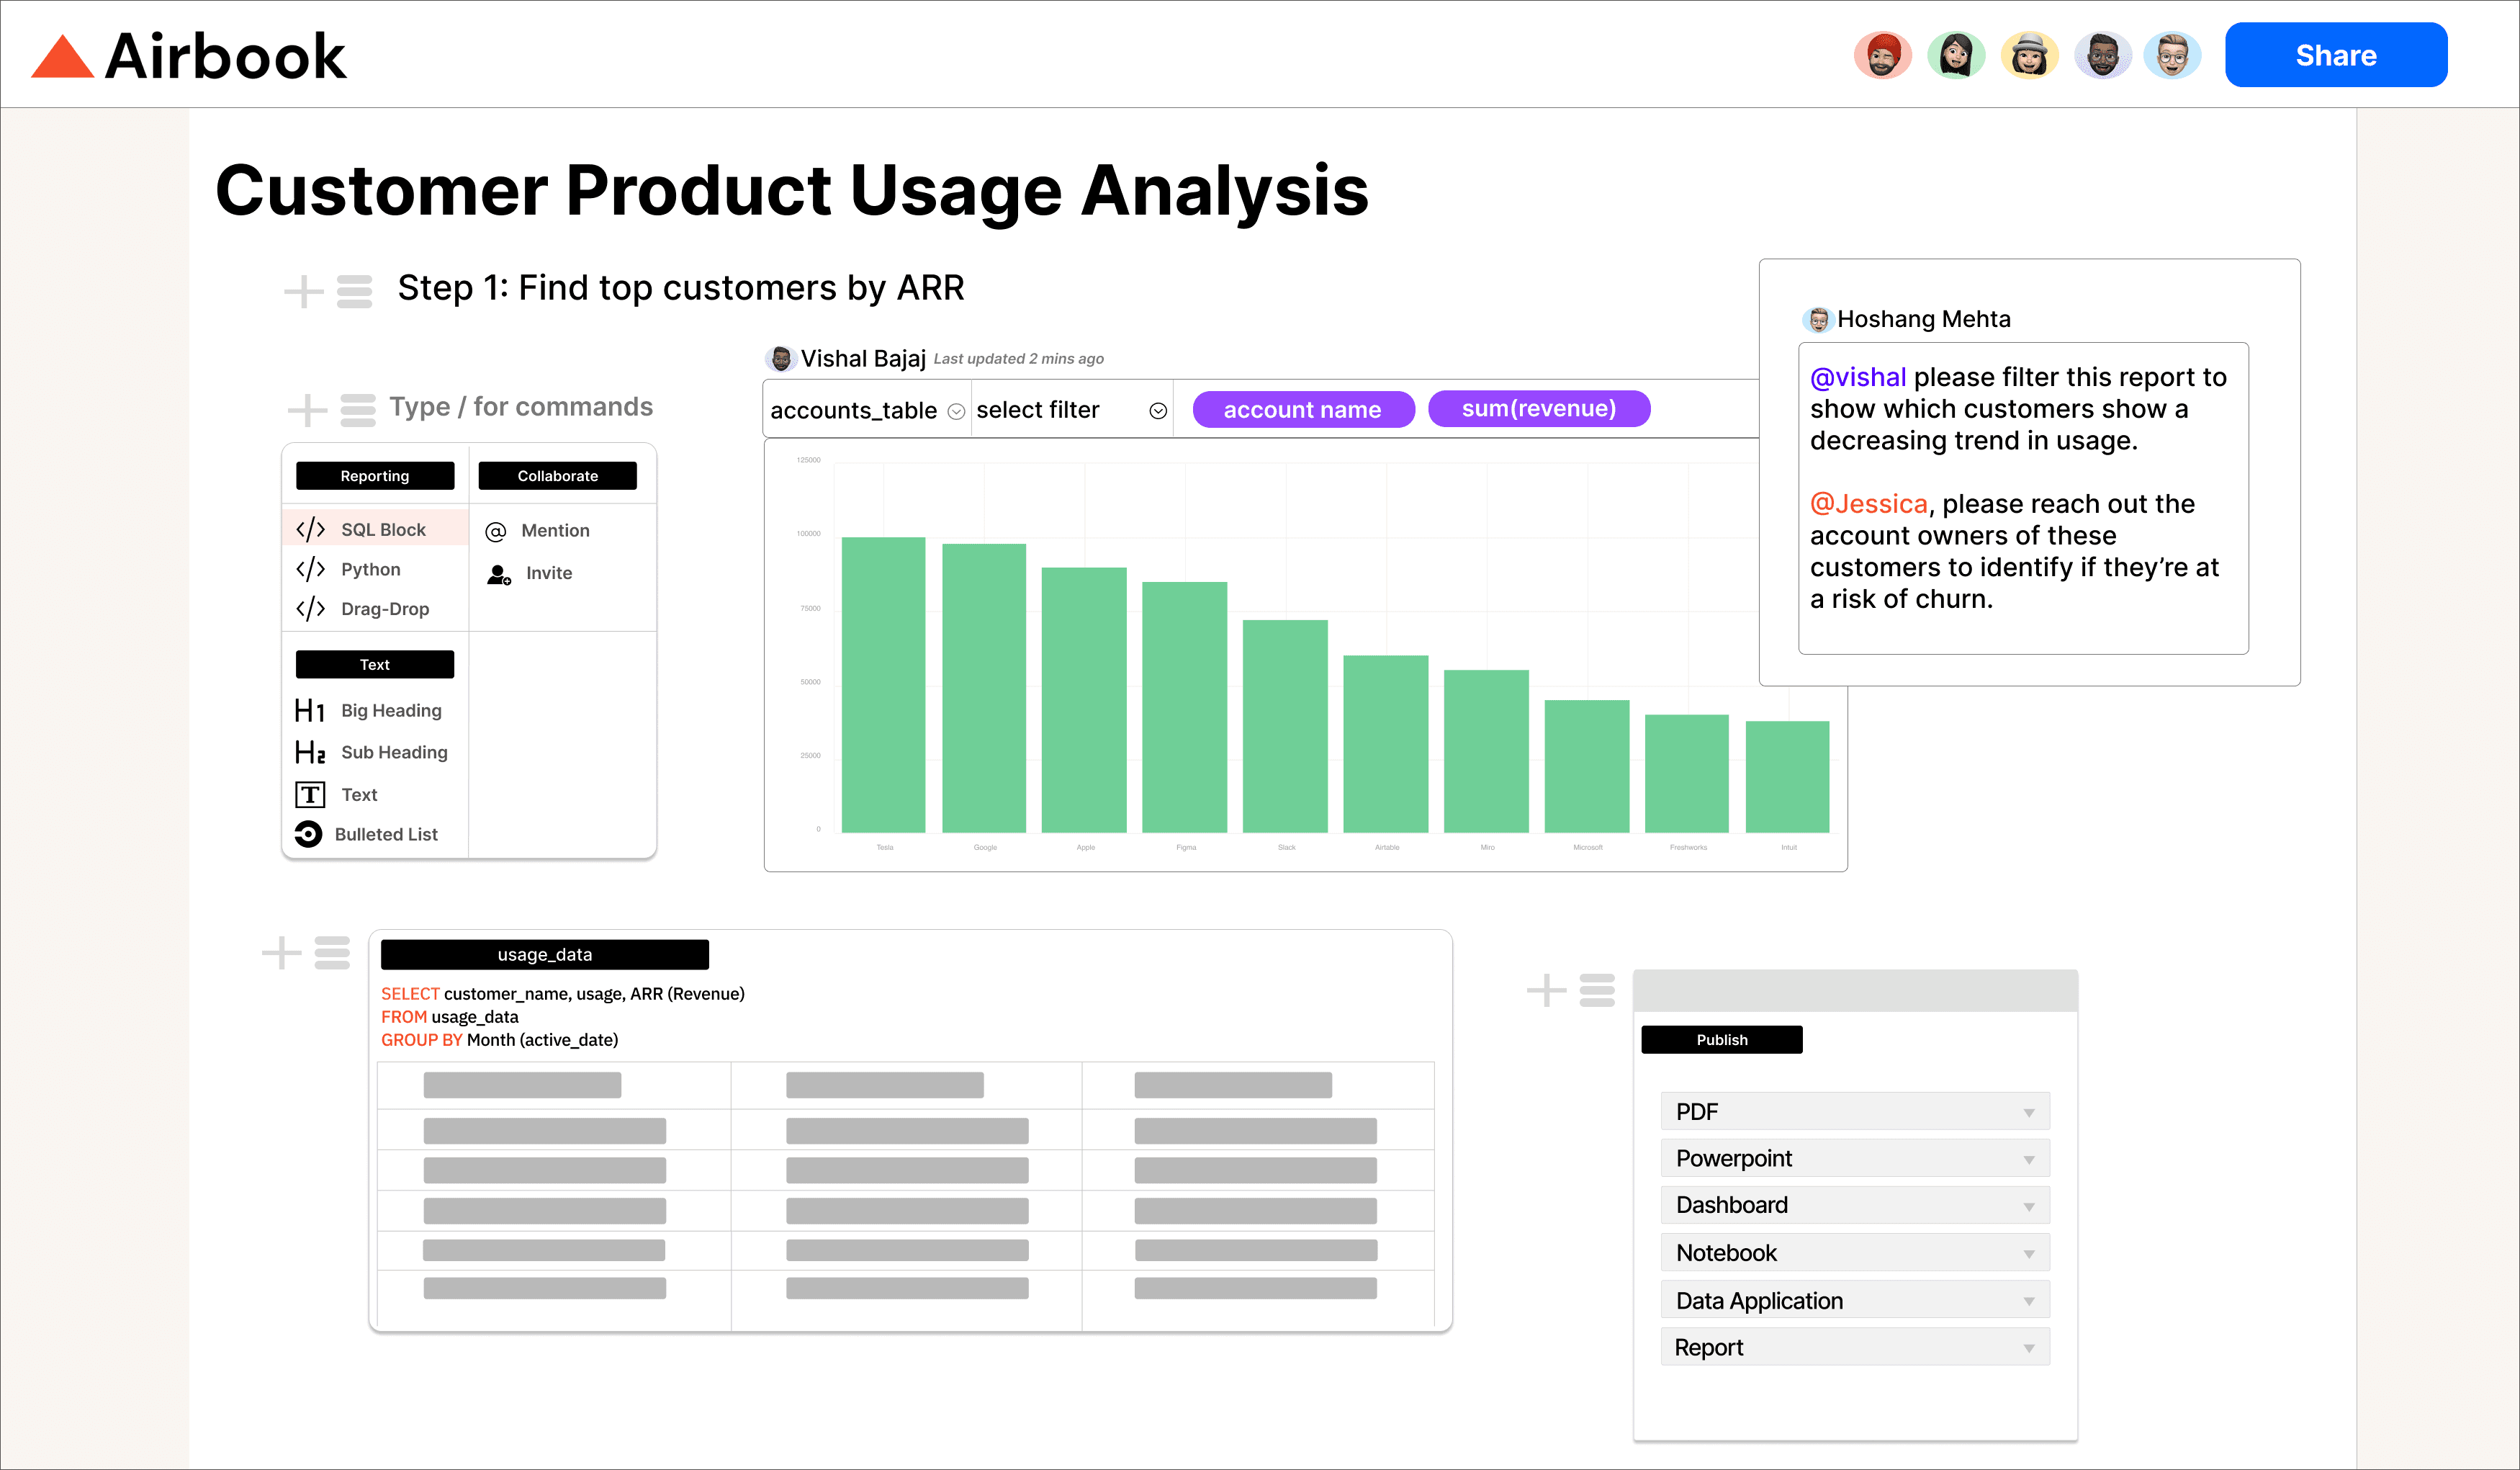
Moreover, these reports are full of author’s commentary to help guide readers on how to interpret the numbers and any considerations to take. Creating a space for everyone involved in the analytical process to add value has a direct impact on making good, informed decisions.
Airbook is one home built for data and revenue teams to come together and drive the last mile of analytics together!
If Airbook looks like a solution you’re looking for, you can get access here- https://app.airbook.io/signup

